GOLD · ~$4,280–4,400/oz “A Third Straight Weekly Decline as a Hike Looks Almost Locked In”
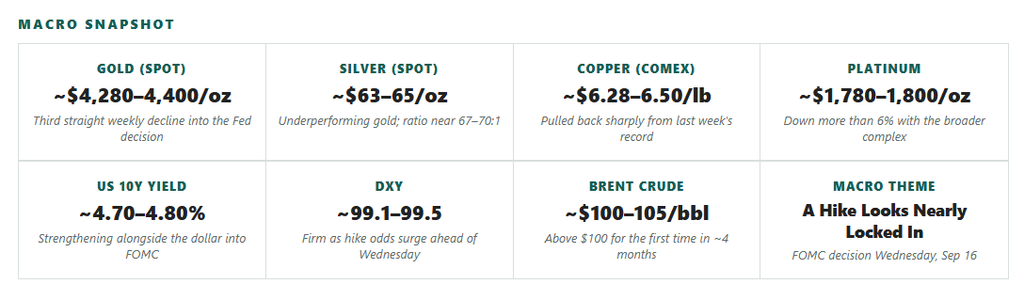
WHAT HAPPENED. Gold has slipped for a third consecutive week, easing to around $4,285–4,348 as of Monday, September 14, down from levels above $4,600 seen in late August. The metal briefly stabilized after last Thursday’s sharp commodities selloff before resuming its slide Monday as fresh Middle East attacks pushed oil above $100 a barrel and hardened expectations for a Fed rate hike this week.
WHY IT HAPPENED — PRIMARY DRIVER (A RATE HIKE THAT NOW LOOKS ALL BUT CERTAIN). August’s producer price report came in hot headline PPI rose 0.4% on the month and 5.4% year-on-year, a tenth above forecast pushing September hike odds toward 60–70% by mid-week. Friday’s CPI report then showed headline inflation holding at 3.4% while core eased to 2.4%, a print markets read as hawkish given the persistence of headline pressure. The decisive move came Monday: following fresh attacks in the Middle East, CME FedWatch pricing for a hike at Wednesday’s meeting jumped to roughly 86.5%, up from 69.4% on Friday morning effectively pricing the hike as a done deal. Both the dollar and Treasury yields strengthened on the news, directly pressuring dollar-denominated gold even as the geopolitical backdrop would ordinarily support it.
SECONDARY DRIVER (OIL ABOVE $100 AND A DIPLOMATIC SETBACK). Over the weekend, a key Saudi oil pipeline the East-West “Petroline,” the kingdom’s main alternative route that bypasses the Strait of Hormuz entirely was attacked, damaged, and at least temporarily shut down, while reports indicated Saudi homes and a mosque were also targeted by Iran and allied forces. Talks between Tehran and its neighbors, which had shown progress over recent weeks, were postponed a meaningful diplomatic setback. Brent crude surged to $104.60 a barrel, closing above $100 for the first time in nearly four months. Normally a bullish signal for gold via the inflation channel, this time the oil spike is instead reinforcing the case for a Fed hike, working against gold on net.
SCENARIOS. Institutional targets remain unchanged from prior months and sit at or above gold’s current price Goldman Sachs ($4,900), JPMorgan ($4,500 for Q4), Bank of America ($4,360), and HSBC ($4,560 average) implying downside from here is viewed as limited by the sell side even after this week’s slide.
- Bull case: the Fed hikes but signals it is a one-and-done move via Wednesday’s dot plot, and gold stabilizes above $4,360.
- Bear case: the Fed hikes and signals more tightening ahead, or a Saudi/Hormuz de-escalation removes the geopolitical floor, pushing gold toward $4,150–4,200.
- Main catalyst: Wednesday’s FOMC decision and accompanying Summary of Economic Projections (dot plot).
SILVER · ~$63–65/oz “The Hike Is Priced In. The Positioning Isn’t.”
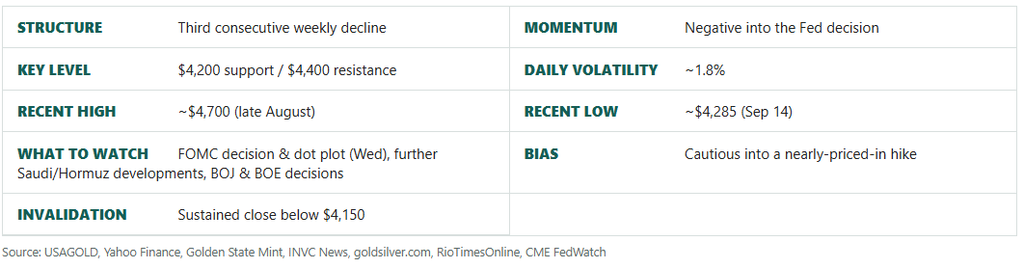
WHAT HAPPENED. Silver has fallen harder than gold this week, sliding to around $63.35–64.79 as of Monday, September 14, continuing Friday’s decline after last Thursday’s sharp selloff. Over the past week, silver’s decline has run more than four times gold’s on a percentage basis a reminder of how much more violently the metal’s real-yield sensitivity and industrial exposure amplify moves in either direction.
WHY IT HAPPENED. The same forces pressuring gold surging hike odds, a firmer dollar, and higher Treasury yields have hit silver harder given its higher beta. The gold-silver ratio has held in a 67-to-70 range since mid-July, a level consistent with the real-yield mechanism doing most of the work rather than any change in either metal’s underlying fundamentals. Notably, none of this week’s price action changes the physical market: the Silver Institute confirms a fifth consecutive annual deficit through 2025 at 40.3 million ounces, and forecasts a sixth for 2026 at 46.3 million ounces a wider shortfall than the year before, with cumulative drawdown of above-ground stocks since 2021 now totalling 762.1 million ounces.
INDUSTRIAL DEMAND & PHYSICAL DEFICIT. Mine supply is structurally rigid most silver comes as a byproduct of gold, copper, and zinc mining meaning a 25-basis-point Fed move does nothing to change the physical shortfall, even as it fully determines the paper price traders see day to day.
- Bull case: Wednesday’s decision proves to be a “sell the rumor, buy the fact” moment and silver stabilizes above $65.
- Bear case: a hawkish dot plot extends the slide toward the $58–60 shelf last tested in early August.
- Main catalyst: Wednesday’s FOMC decision and dot plot, then the next CPI report on October 14.
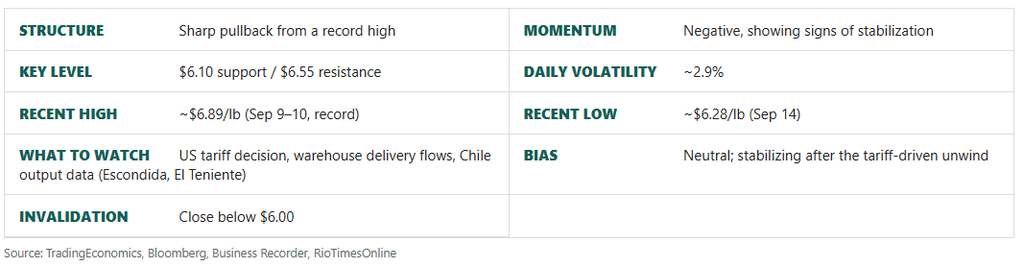
COPPER · ~$6.28–6.50/lb “A Record High, a Tariff U-Turn, and the First Losing Week Since June”
WHAT HAPPENED. Copper has whipsawed sharply after setting a fresh all-time high above $14,875/tonne on the LME (roughly $6.89/lb on COMEX) around September 9–10, before plunging nearly 5% the same week and closing at $14,233/tonne on Friday its first losing week since June. The slide continued into Monday, with COMEX copper falling a further 2.86% to $6.28/lb, though Tuesday brought signs of stabilization as fresh warehouse deliveries eased the supply squeeze.
WHY IT HAPPENED — SUPPLY (PRIMARY DRIVER). The trigger for the reversal was a policy U-turn: the Trump administration reportedly delayed its decision on tariffs for refined copper imports, with US officials said to be concerned the proposed levies could push domestic prices even higher and further increase manufacturing costs. This unwound much of the stockpiling premium that had driven copper to its record, and fresh deliveries of stockpiles to exchange-tracked warehouses have since signalled that the supply squeeze outside the US is starting to ease. Even so, the longer-run physical story remains tight: Escondida, the world’s largest copper mine, is now mining ore grading just 0.90% copper, down from 1.02%, with BHP guiding toward roughly 0.70% next year; Codelco’s flagship El Teniente mine produced 27% less copper in the first five months of 2026 than a year earlier after its Andes Norte expansion was suspended in early August over seismic risk.
DEMAND (SECONDARY DRIVER). AI data-center and grid-electrification demand remain the unchanged structural driver, though this week’s price action was almost entirely a policy and inventory story rather than a demand one.
- Bull case: Washington reverses course again and confirms the tariff, or Chile’s structural grade decline reasserts itself once the current inventory relief fades, pushing copper back toward $6.70+.
- Bear case: further warehouse deliveries continue to ease the squeeze and the tariff stays shelved, extending the pullback toward $6.00–6.10.
- Main catalyst: any formal update on the US refined-copper tariff decision, and confirmation of how much further inventory relief materializes this week.
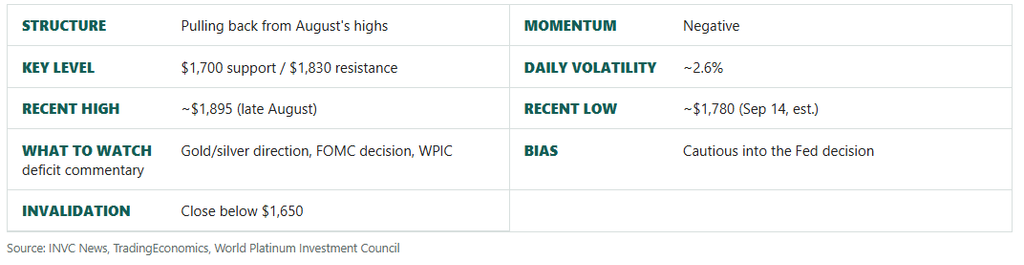
PLATINUM · ~$1,780–1,800/oz “Caught in the Same Rate-Hike Downdraft as the Rest of the Complex”
WHAT HAPPENED. Platinum has fallen alongside the rest of the precious-metals complex, trading near $1,797/oz as of Monday, September 14, after falling more than 6% during last Thursday’s broad commodities selloff alongside gold, silver, and copper. The metal has given back a meaningful portion of the strong run it built through most of August.
SUPPLY RISK (PRIMARY DRIVER). The structural case is unchanged: the World Platinum Investment Council continues to project a fourth consecutive annual supply deficit for 2026, with constrained South African mine supply and elevated energy costs the persistent headwinds. That backdrop has been fully overshadowed this week by the same dollar and yield strength weighing on gold and silver.
DEMAND RISK & LONG-TERM CATALYST. The continued shift toward electric vehicles remains a cloud over the demand outlook even against the tight-supply backdrop, while China’s expanding hydrogen fuel-cell fleet remains the structural long-term catalyst.
- Bull case: Wednesday’s Fed decision proves to be the peak of hawkish positioning and platinum stabilizes above $1,800.
- Bear case: a hawkish dot plot extends the across-the-board precious-metals slide, pulling platinum back toward $1,700.
- Main catalyst: gold/silver direction around Wednesday’s FOMC decision.
This report is for informational purposes only and does not constitute investment advice. All prices are approximate and subject to market conditions. · Pan Asia Market Intelligence · 14 September 2026